Hello, dear citizen of the free world. I’m writing while I’m in a restricted lifestyle. On Monday night Italy’s prime minister decided that the entire country would be covered by restrictions that can be summarised as follows:
“I stay at home”
All travel was banned unless justified on professional or health grounds. You can go out to buy food and medications and nothing else. You can’t visit your parents if they are in a different neighborhood. I’m working remotely 100% of the time and trying to survive with two kids with a lot of spare time 😰.
The situation is serious just because the health care system is at its maximum capacity and lives of the elderly and other people with serious chronic afflictions are at stake. That said everything is fine: we have food and the sun shines as always in Italy.
So since I was already playing around with the Facebook Prophet library, I’m trying to put something together.
The government has been so efficient, beyond any expectation, to set up a Github repo with all the data cand even to update them daily!
I focus my effort on my province since there is less noise (regional and countrywide data could be misleading because the lockdown happened in different moments) and we are near the initial outbreak. And also I live here!
Disclaimer: This is more an exercise in building a time series pipeline rather than find significant data on when exactly this situation will end. I’m no epidemiologist. There are specific models for that and I’m purposely using one from a social network.
So the situation seems to flat out after 22 / 25 days.
So I clean up the data with pandas, filtered just the rows about my province and shape them to suit Prophet requirements
 bs= df.loc[df['sigla_provincia'] == 'BS']
    bs = bs.sort_values(by=['data'])
    bs = bs.drop(['stato', 'codice_regione', 'denominazione_regione','codice_provincia','sigla_provincia','lat','long','denominazione_provincia'], axis=1)
    bs = bs.reset_index(drop=True)
    bs.columns = ['ds','y']
Then I run 50 days forecast on this data.
    m = Prophet()
    m.fit(df)
    future = m.make_future_dataframe(periods=50)
    forecast = m.predict(future)
That is suspicious: we had more cases than in China. I have more confidence with the Italian data, but since the curve is monotonously increasing the prediction will just follow. In the hope to make some sense in this forecast, I added a regressor that made some sense: the number of days since the lockdown in Italy. Sadly is the same day that the data started to be recorded so it does not add much information. So I added two seasonalities to model the expected peak after 25 days after the first case and another after 14 days when new infections are less than the healed ones.
m = Prophet()
m.add_regressor('peak_reg')
m.add_seasonality('peak_period_start',period=22,fourier_order=1)
m.add_seasonality('peak_period_end',period=36,fourier_order=1)
m.fit(df)
future = m.make_future_dataframe(periods=28)
future['ds_ts'] = pd.to_datetime(future['ds'])
future['no_school'] = pd.Timestamp(datetime(2020,2,24))
future['since_no_school'] = future['ds_ts'].sub(future['no_school'], axis=0).dt.days
future['peak_reg'] = future['since_no_school'].apply(peak_days )
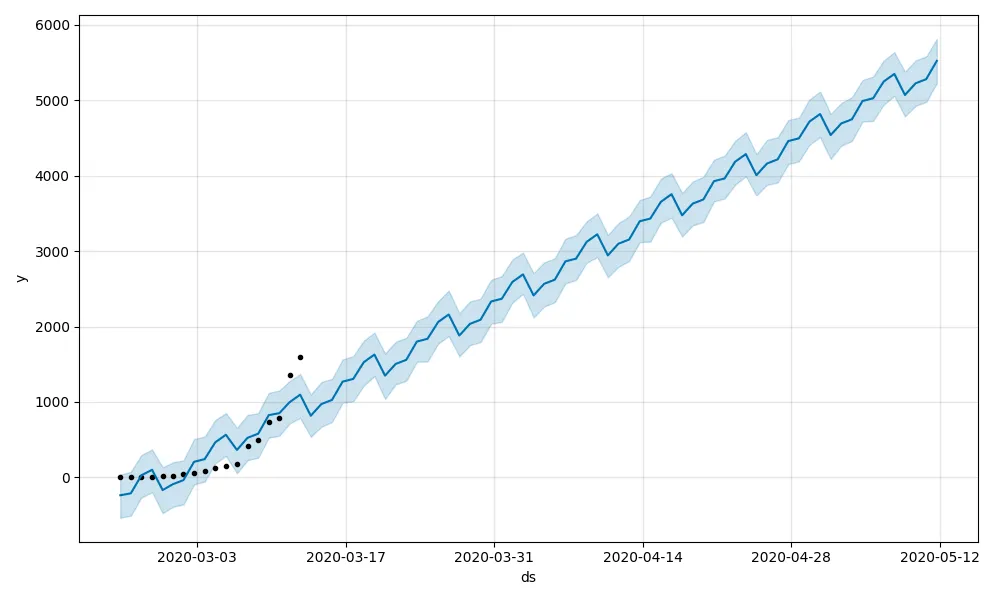
forecast = m.predict(future)
[image](https://miro.medium.com/v2/resize:fit:1400/format:webp/1*uGUU8V4cwMeSz2IFWlr4yA.png)

The result is probably overfitting the burst we have in the last few days and the data set is so small. So the 8K infected predicted before the peak is an exaggerated estimation. But the dates of the estimated time of peak are the same as the epidemiologist model! I’m going to build a pipeline to run the model every day with new data and enhance the model estimations. Worst case scenario: the second day that the prediction is higher than the actual value the peak ha been reached and I learned something about Facebook Prophet. Best case scenario: I can predict the end of the lockdown and go back to the office.